
This post was authored by Van Orhari.
As a media theorist and experimental music artist, I get very grumpy when I come across videos that combine synthesizers and data to “hear” nature. Maybe you’ve seen them on one of your feeds: a mushroom in a forest with electrodes clipped to the edge of its cap, and those electrodes leading back to a modular synthesizer rack (see fig. 1). The captions on these videos would have you believe that the mushrooms are “playing” the synthesizer, or even worse, that the synthesizer is producing “the sound of” these mushrooms. This is not true, and in fact, it’s egregiously reductive.
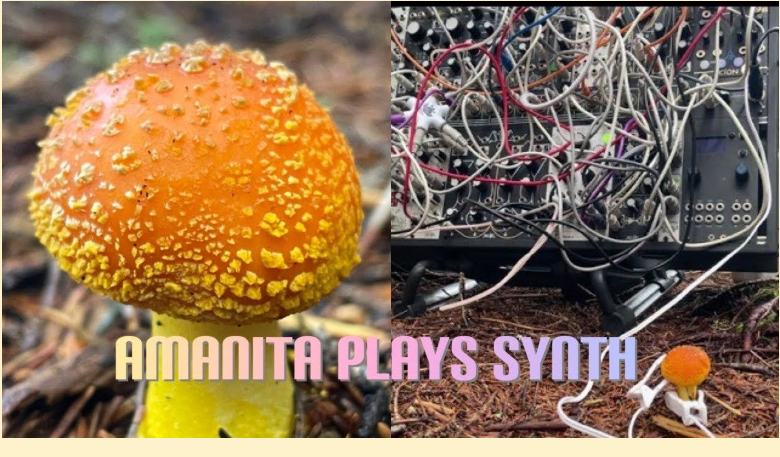
Fig. 1. The thumbnail of one of the many videos claiming that mushrooms can play synthesizers. MycoLyco. “Amanita Frostiana Mushroom Plays Eurorack Modular Synth Using Bio Data Sonification: Yay Mycology.” YouTube, 2021, https://www.youtube.com/watch?v=7sj32cRKUYo.
The electrodes are measuring electromyographic data, sure. But when the voltage of this bioelectrical activity is measured, it appears as random variation, and that variation in voltage is processed in such a way that what is “analog” (as opposed to discrete: zeroes and ones; notes on the chromatic scale) about the mushroom is stripped away by its sonification. In other words, data sonification, in this instance, is turning random numbers into a limited range of notes. The person who programmed the synth decides how the random numbers being generated by the mushroom are transformed into melodies or musical figures. In truth, one of the least meddled-with sonifications of (the bioelectrical activity of) a mushroom would sound like variants of white noise, since white noise is an audio signal of random change (see fig. 2).
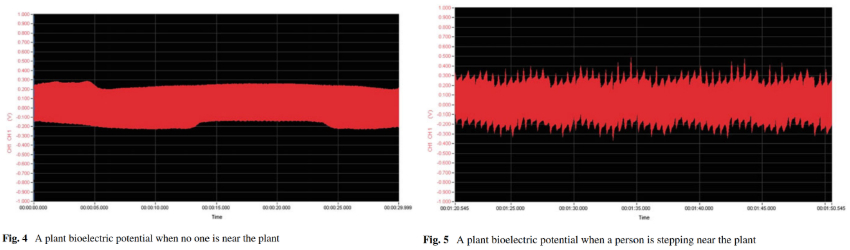
Fig. 2. Graphs comparing plant bioelectric potentials in response to human presence. A musically-legible (i.e. pleasant) rendering of this data would obfuscate the measurements. Imam Tahyudin and Hidetaka Nambo. “Bioelectric Potential Plant.” Data Science and Digital Business, Springer International Publishing, 2019, pp. 288-289.
Now, maybe that sounds like I’m killing the vibe. But I’m not calling this phono-mycological party trick out because I hate the idea of magic. Rather, I do this because I believe that data sonification is something that can do things that approximate magic, while still maintaining a connection to reality—without resorting to any sleight of hand.
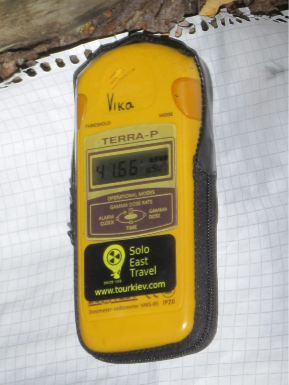
Fig. 3. A Geiger counter for tourists in Ukraine, circa 2017. amanderson2, “Geiger counter pretty high on a hotspot by the river Pripyat Chernobyl exclusion zone Ukraine.” Flickr, 2017, https://flic.kr/p/WgSQpW.
Consider the Geiger counter: it is a data sonification device that makes radiation perceptible; it tells you something about your immediate environment in a direct way (see fig. 3). The faster the Geiger counter clicks, the greater the likelihood that you should be wearing a lead-lined hazmat suit. Put differently, it’s less dishonest to say that radiation can play the drums than to insist that mushrooms can play the synthesizer.
When a weak methodology is used to link sound arts to sciences, the result is a sterile hybrid with an identity crisis. The mushroom-as-music-producer idea tries to appear scientific, but is secretly artistic in its structure, because it is an interpretation of data that lays claim to an objectivity it doesn’t actually have. Of course, all representations of data are interpretations, but the difference here is the level of concealment and mystification that this kind of data sonification employs.
Interpretations of data are productive not when they “tell” the analyst something about the object of study as a fact, but when they offer a perspective on said object that allows the analyst to contribute to, in the language of cybernetics, a feedback loop. Like scientific replication studies that fail to produce the same results as the original experiment, feedback loops help us figure out what needs to be changed in our methods and how to make those changes.
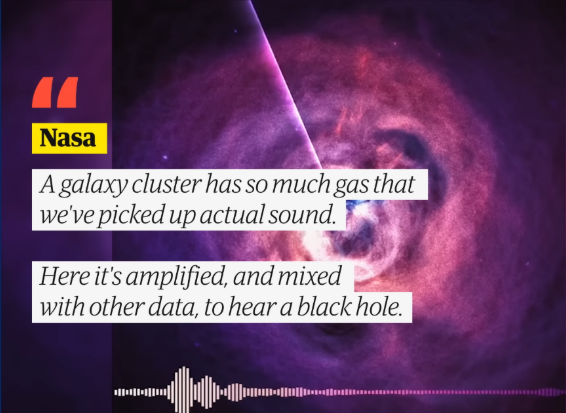
Fig. 4. A sonification of a black hole that is “amplified, and mixed with other data” in an opaque manner. The Guardian. “Nasa releases audio of what a black hole ‘sounds’ like.” YouTube, 2022, https://www.youtube.com/watch?v=_tXhBLg3Wng.
Now what does this have to do with tinkering hippies lying to us? My point here is that things like mushroom music and NASA’s “recording” of a black hole (fig. 4) do not give us anything to put into the loop of feedback. This is why I used the Geiger counter as an example earlier, because its sound helps its user achieve something desirable: it helps them not die.
I want to set myself apart from the “erm, actually…” crowd on this matter: I am not arguing against the practice of translating complex, abstract things into simpler forms so that they can be rudimentarily understood. I would not stand around in front of a Geiger counter going off at 1,000 clicks per minute to explain to someone why “that’s actually not what radiation sounds like.” Instead, I would run away as fast as my essayist legs would allow me to.
This analogy, despite its ridiculousness, represents the rationale behind my Python incubator project. I want to use Python to build my own data sonification program, but one that attends to the tension between utility and mystification in sonification practices. Jennifer Gabrys’s book How to Do Things with Sensors provides a framework for the kind of technology I’m developing, though its title is somewhat misleading. How to Do Things with Sensors is not a traditional manual; it is a theoretical text intended to steer tinkerers such as myself away from a “mode of technological engagement that is meant to lead to specific political effects” (95). Grabrys’s research deals with air pollution sensing, but she is cognizant of the fact that simply proving that our world is polluted doesn’t stop it. Rather, her devices are meant to encourage us to collectively ask, “Okay, what do we try next?”
Therefore, my data sonification program aims to be a meta-program, a program that plans to fail. Its failure would be a means of contributing to the feedback loop. Instead of representing things that are inherently straightforward (high radiation levels = bad) or obfuscating my methods to swindle people into believing in magical science-sounds, my program will generate questions about sonification for other practitioners to consider. It won’t “tell” you things about any specific dataset, but rather, it will help you figure out what can be usefully represented through sonification.
As such, figuring out what this meta-program would look like in practice is the bulk of the work. The sonification practices that I’ve addressed all use parameter mapping (see fig. 5), where something like a synthesizer’s pitch is altered by numerical variation in a dataset across time. If I hooked up my thermostat to a synthesizer and mapped the actual temperature readout to control the pitch of one oscillator (i.e. the thing that generates the initial sound in a synth) and the desired temperature to control the pitch of another, then I would know that my apartment is the temperature I set on the thermostat when my synth stopped sounding dissonant. Instead, it would seem to be playing only one note, since both oscillators would have the same exact pitch.
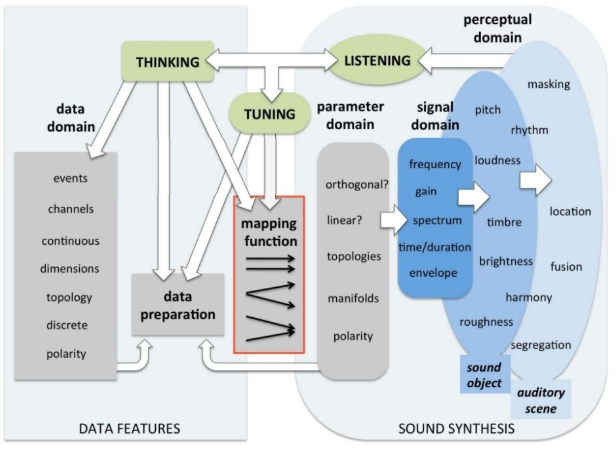
Fig. 5. A representation of a parameter mapping system. Florian Grond and Jonathan Berger. “Parameter Mapping Sonification.” The Sonification Handbook, Logos Publishing House, 2011, pp. 366.
There are already numerous tutorials on how to do parameter mapping, with coding templates to go along with them. Learning Python allows me to set these things up with greater ease, but more importantly, it will allow me to play with the templates’ structure. Currently, the most tempting approach is to code the program to scramble the parameter mappings’ ranges when it recognizes a pattern.
Often, there are comments on mushroom synth videos like this one: “Surprisingly almost exactly how I expected an Amanita to sound.” As we have established, this is because the parameters were specifically mapped (and the synth was specifically programmed) to interpret the raw data in a way that meets expectations. Instead, I will use Python scripting to try and tease out the boundary between what is grounded in utility versus what is imposed by sentimentality in my interpretation of data.
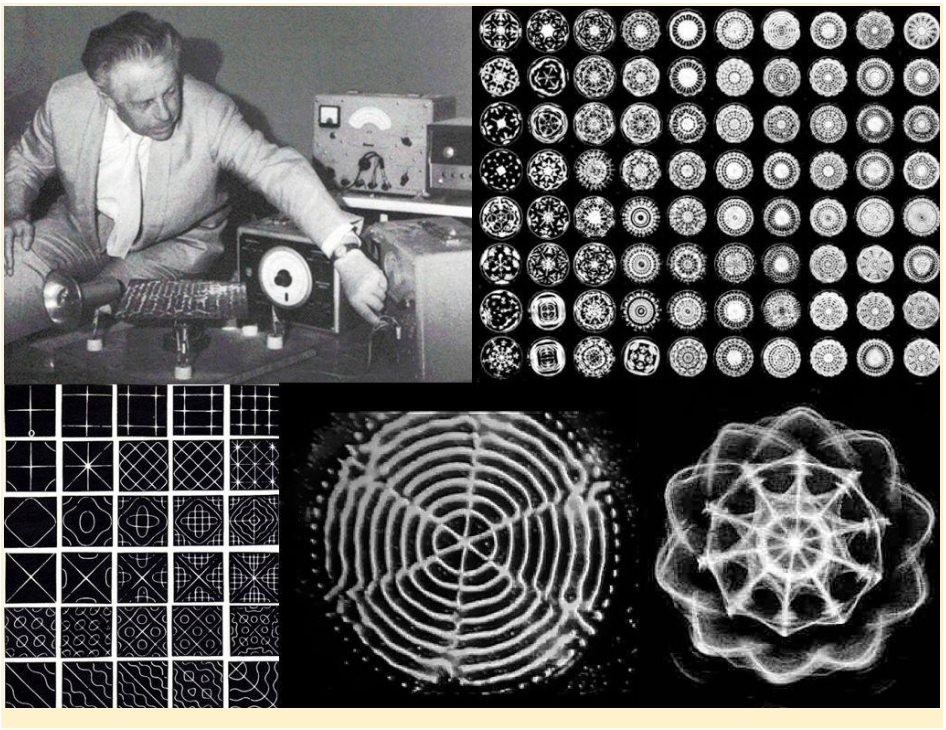
Fig. 6. Cymatics is the phenomenon of vibrations distributing a substance across a surface in the form of the strange shapes pictured here. Idis Turato. “Oblici Zvuka, Zvukovi Oblika.” 2014, https://www.idisturato.com/2014/05/04/oblici-zvuka-zvukovi-oblika/.
I suspect that, in order for data sonification to reliably work as an analytical tool, it may have to let sonification-friendly datasets reveal things about the methodology’s own limitations. For example, synthesizers are remarkably good at emulating the sounds of ocean waves. Therefore, another line of inquiry that would be useful to explore is if there might be a non-arbitrary connection between data sourced from ocean waves and the sound of waves generated by an oscillator in a synthesizer. Similarly, the phenomenon of cymatics (see fig. 6) is worth investigating, since it is a form of vibrational visualization.
The sounds that will come out of this project will be interesting, to me at least, but they most likely will not be aesthetically pleasing. Consulting graphs and tables is not usually an aesthetically pleasurable process, so it makes one wonder why sonified data would need to be. The unknowable and unrepresentable nature of nature is its strength, so the desire that some have for there to be empirical beauty is confounding. In other words, this project will not have any mushroom synth wizards, because they do not exist.