
Authored by Bung-Woo Jun
Five, ten, twenty. Three numbers are presented side by side. What is the next number? Many people would probably answer 40. Then, what number comes after 40? Again, many people would probably say 80. But is that really the case?
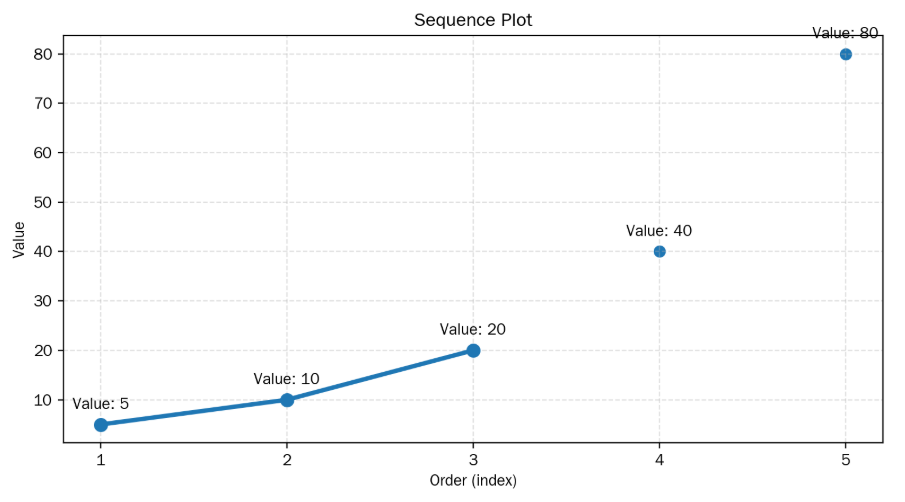
In fact, the first three numbers mentioned above—5, 10, 20—were the number of home runs a certain baseball player hit over a three-year period. The player’s agent is Scott Boras, who is often called the worst sports agent among MLB teams because, while he creates opportunities for players to earn extremely high salaries, he also pushes teams to compete with one another to spend astronomical amounts of money by introducing new baseball statistics. Boras presented a data visualization showing the numbers 40 and 80 following 5, 10, and 20, just as ordinary people would expect, and secured one of the greatest Major League contracts in history for the player he represented. The player’s name was Johnny Damon.

Although I was very young, this news sparked my interest in data and data visualization. How can one construct and present a data visualization using the data that best highlights one’s strengths out of countless pieces of information? Also, how can one accurately interpret the data presented by the opponent without distortion or misunderstanding?
My interest in data, which I’ve had since childhood, continued even while working as an elementary school teacher. In fact, it was inevitable because the language arts, social studies, science, and math textbooks that elementary students learn from included countless data and data graphs, and I had to teach students how to correctly interpret the data or data visualizations in the books, and how to find or create and present a data visualization that supports their own views.
Part of my data visualization class with 5th-grade elementary students was as follows: I asked the students when summer begins in Seoul, South Korea, the city where we lived. And the students answered based on their own reasoning. One student said that July 15th, when our school’s summer vacation begins, marks the start of summer. Another student said that July 1st, when the outdoor swimming pools open, is the beginning of summer. So, I taught them how to use Google Data Trends and assigned a language arts task where they had to find appropriate evidence from Google Data Trends and present a paragraph discussing when summer starts.
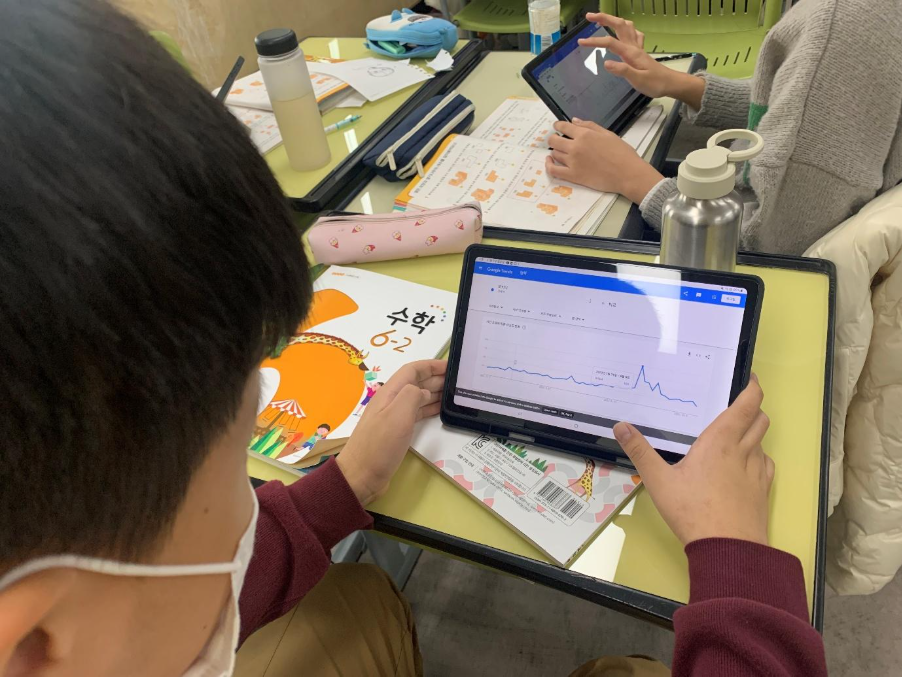
In fact, the students supported their writing by finding and presenting surprisingly compelling data. I still remember two students’ responses. One who announced that summer began on June 20th because that was when the word “ice cream” suddenly started as a more frequent search. The other student challenged this way of identifying summer, asking if this meant that the period around Christmas, when ice cream search volume also increases, must be considered the start of summer as well. Ultimately, I had no choice but to give an A to most of the students who participated in this assignment, and I pondered whether there was a way to measure and improve the developmental process of an abstract concept like data visualization literacy in students.
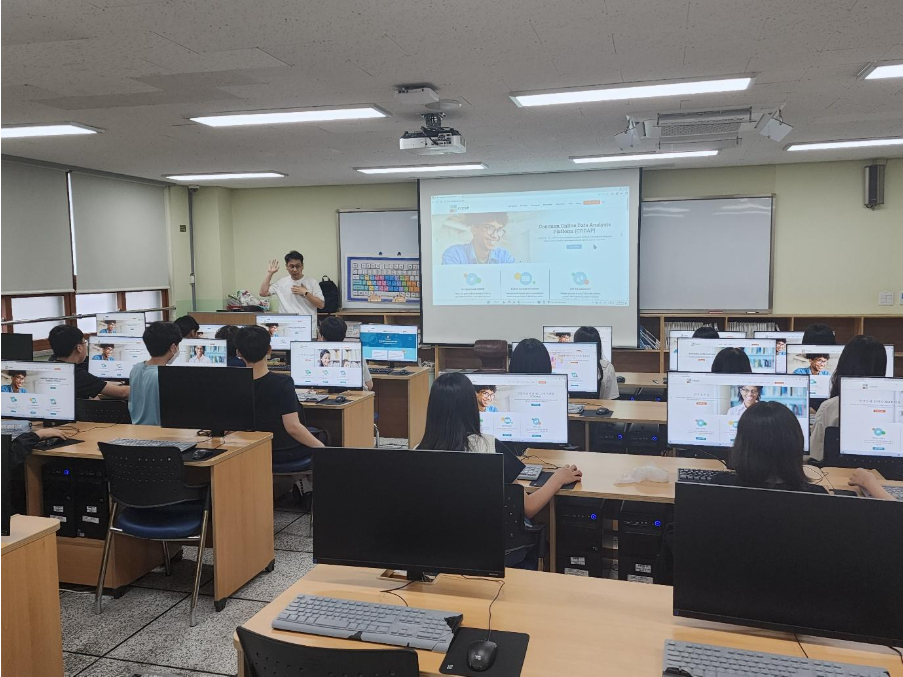
Although I didn’t know the precise term while working as a teacher, as I studied more about data science education in my master’s and doctoral programs, I realized that the ability to interpret and construct data visualizations is precisely data visualization literacy. In other words, the ability I wanted to develop, and the one I wanted to foster in my students, was data visualization literacy. However, it was overwhelmingly daunting to figure out how to measure and improve the abstract concept of data visualization literacy.
I started my master’s degree in data science education with the questions I had as a teacher, and I am currently in my third year of a doctoral program in Instructional Systems and Learning Technologies at Florida State University. In fact, up until my first year of the doctoral program, I had no clue how to accurately measure the developmental process of data visualization literacy. However, last year, while reading a paper related to computational thinking, I learned that the development of students’ thinking skills could be measured by analyzing log data generated during the students’ use of software. Specifically, through log data, researchers could trace students’ thought processes by observing how many attempts it took for students to complete a task, and in what sequence and which buttons they clicked to complete the task before the final completion. Furthermore, log data is collected in real time without the students being aware, which truly reflects their thought processes, offering the advantage of reducing misunderstanding or distortion caused by external factors.
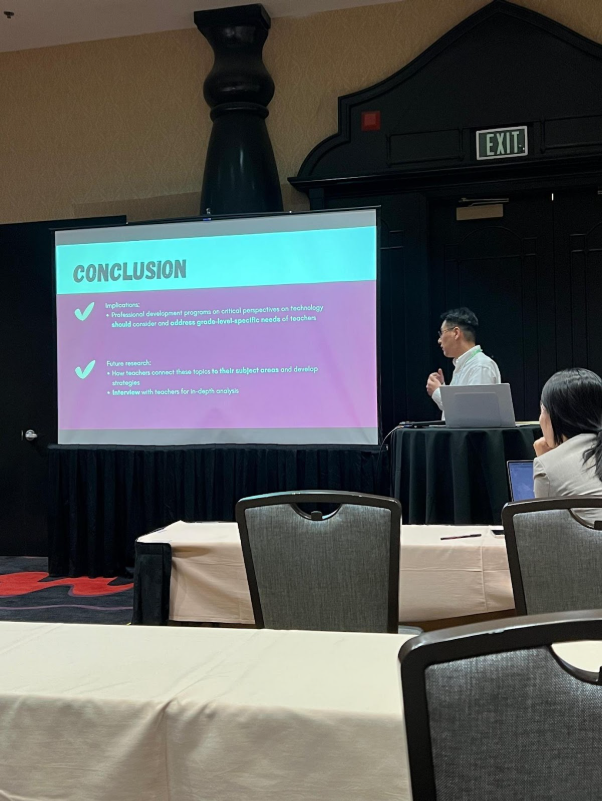
I was also amazed that when analyzing data on a large scale, researchers didn’t have to manually analyze the data themselves, but could use Python for machine learning. Unfortunately, I did not possess the Python skills required to analyze log data through machine learning, so I was unable to implement what I had newly learned from reading the paper.
It was then that I learned about the Digital Research Incubator program, and I felt it was the perfect opportunity to learn data analysis methods using Python and advance my research on data visualization literacy. I hesitated, wondering if I could really do well, but quickly discovered that the learning materials provided by the Digital Research Incubator program were aimed at beginners like me, teaching content step-by-step from the very basics. Even after seven weeks, Python still feels difficult to implement, but with the help of ChatGPT and Copilot, I’ve been able to write code to analyze log data, and recently, I even had the opportunity to attempt video data analysis, something I hadn’t even considered when starting the Digital Research Incubator program.
I am still a beginner, but precisely because I am a beginner, I feel the same excitement as when I first learned a foreign language—English. Like acquiring a new language, the possibilities opened up by learning Python make me happy. Sometime in the future, if I, Bung-Woo Jun, am considered an expert in data visualization literacy, I will say that the Digital Research Incubator was one of the inflection points that helped me grow into an expert.